Reading results
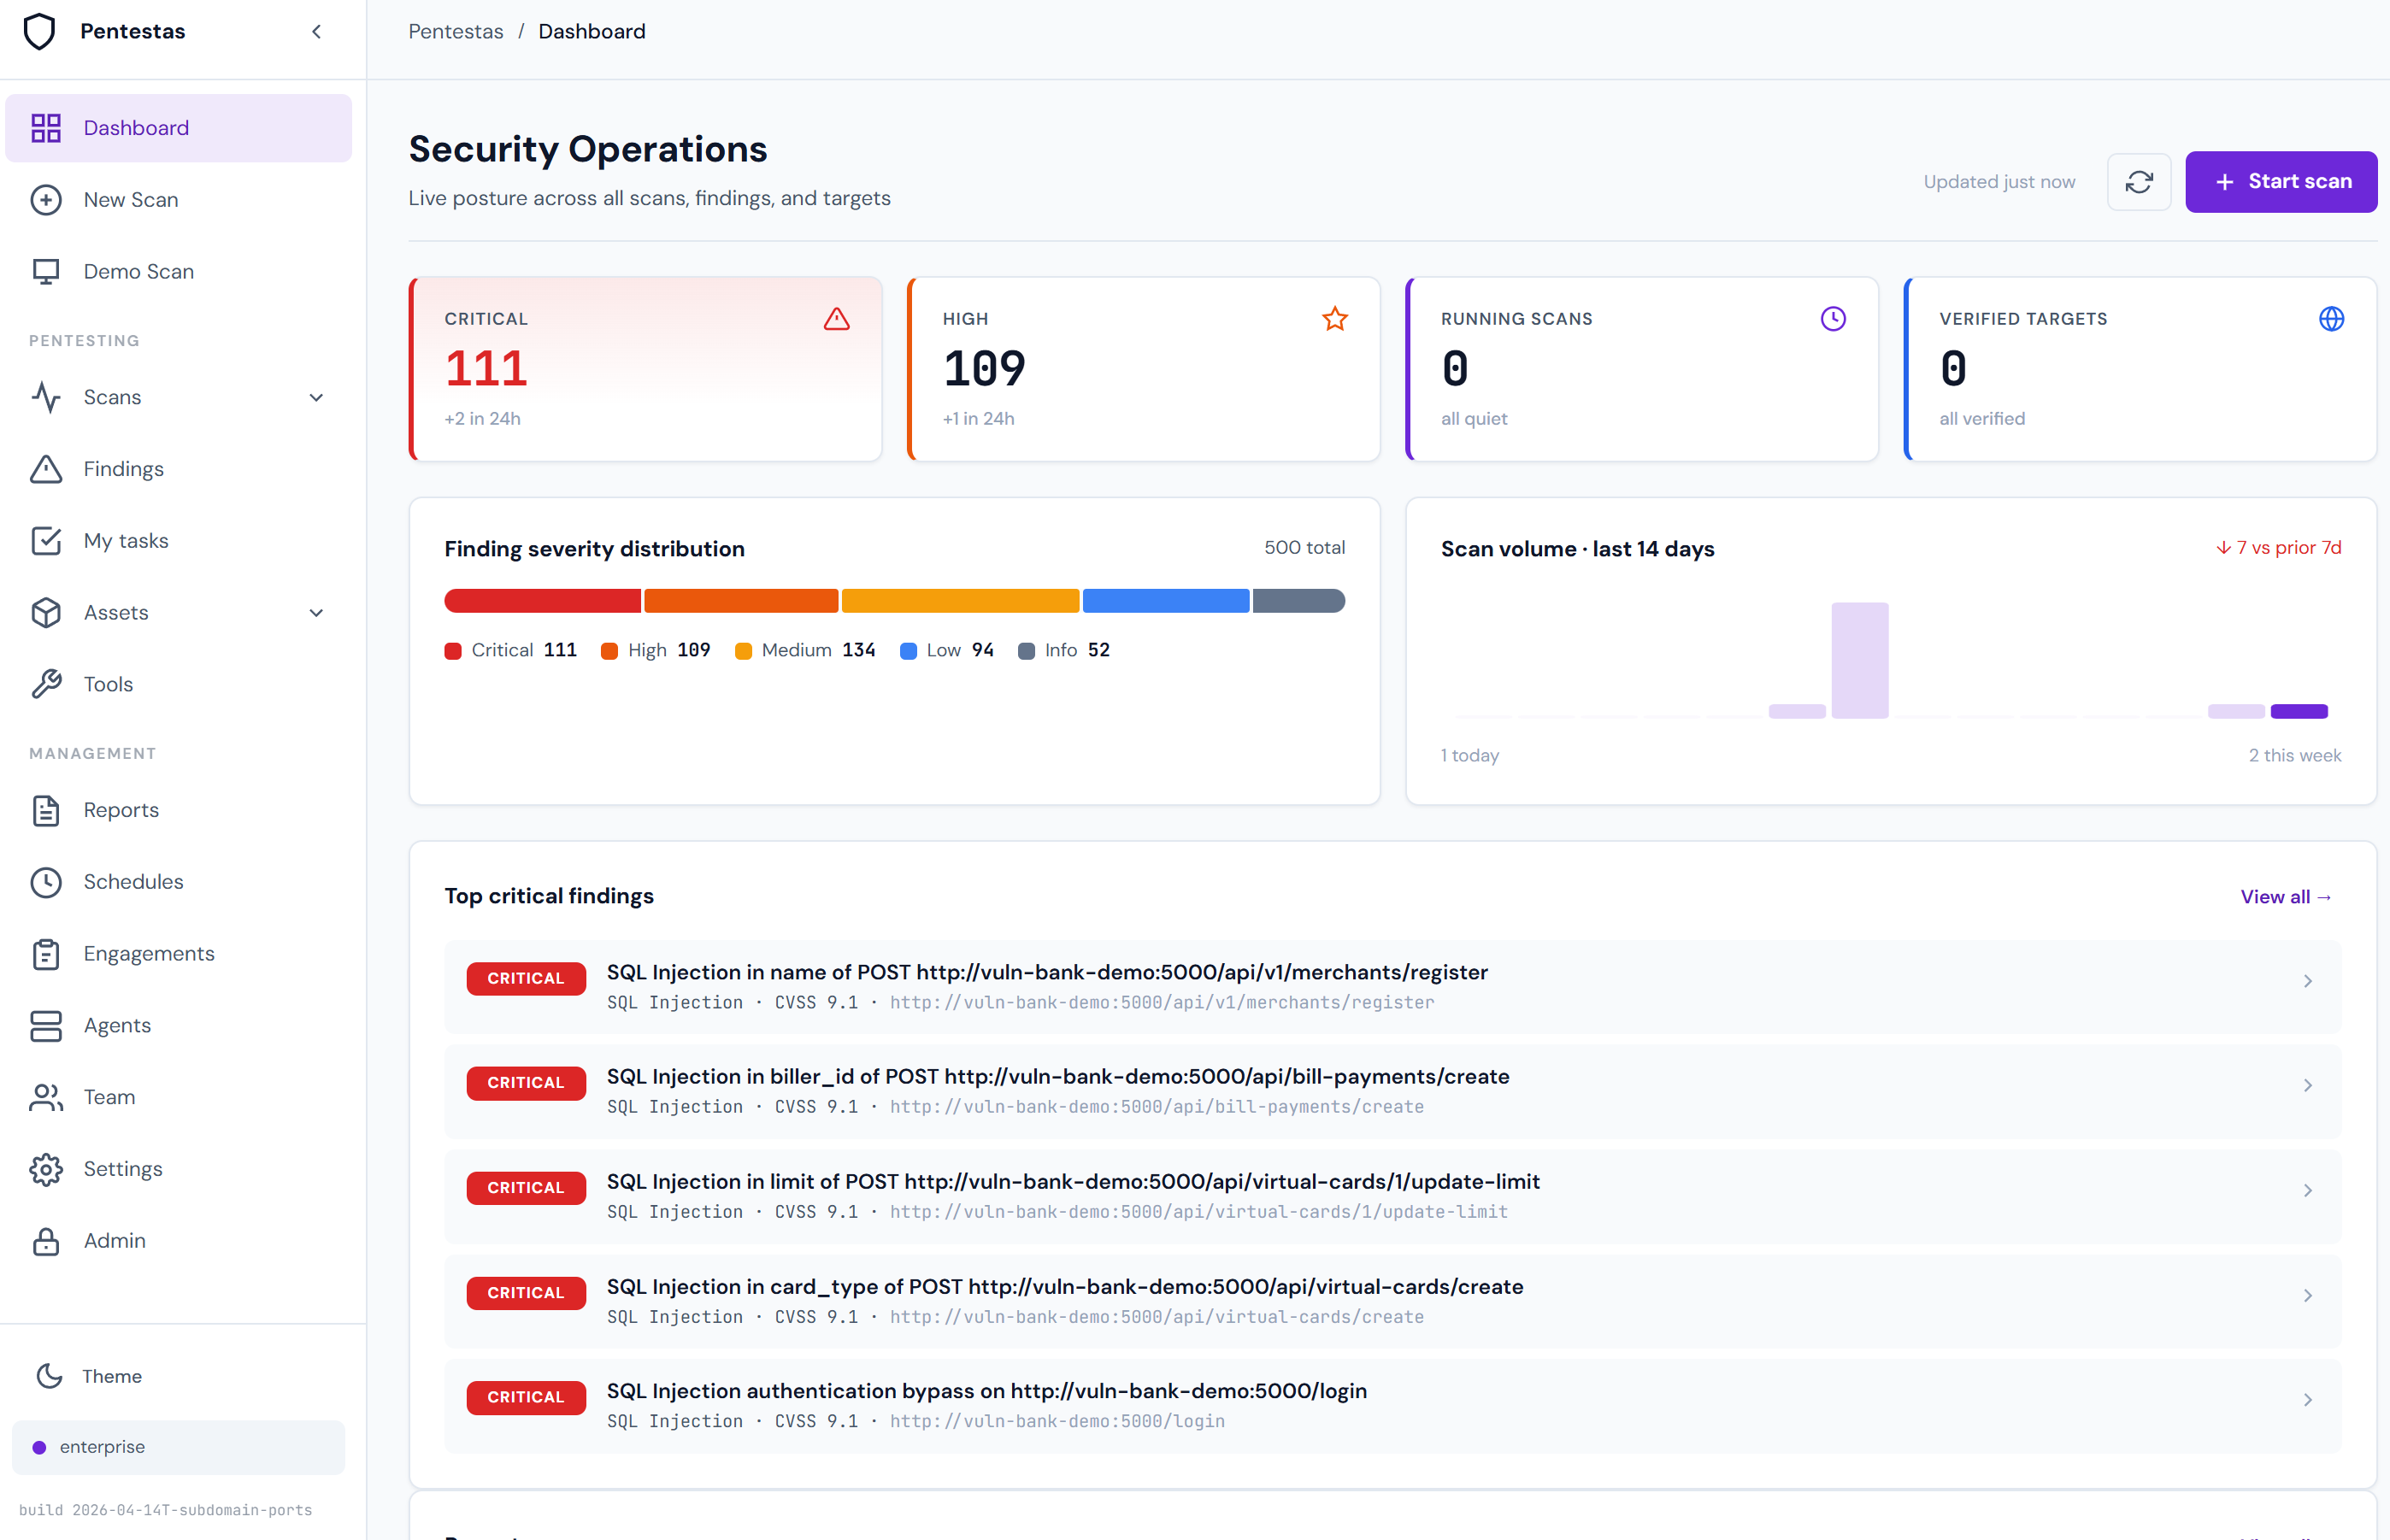
The Scan detail page is where most time is spent. It renders everything a single scan produced, organised so the highest-signal information is at the top.
Top-of-page summary
- Target + status — URL, scan types, current phase, duration.
- Finding counts by severity — five pills (CRITICAL → INFO) with counts. Click one to filter the list below.
- Attack chain map — if Pro+ AI is on, this is the first thing to read.
- Action buttons — Rerun, Export report, Share link, Delete.
Attack chain mindmap
The mindmap is the single most important view on this page. It shows multi-step compromise paths — sequences of findings that, combined, escalate to a critical outcome.
Example: exposed .env file (LOW by itself) → DB creds leaked → database RCE via misconfigured extension = CRITICAL.
Read chains left-to-right. Node colour = severity. Click any node to jump to the underlying finding.
Chain synthesis is driven by rules + LLM validation. See Attack chain synthesis for details.
Findings list
Sorted by severity (CRITICAL first), with a per-row toolbar:
- Verified badge — the finding was re-run through an independent verifier and still triggered. Filter for
verified:trueif you only want high-confidence items. - Proof block — HTTP request + response that demonstrates the issue. Sensitive bodies are encrypted at rest (per-tenant Fernet key).
- CVSS score + vector — CVSS 3.1, calculated per-finding based on exploitability + impact context.
- Validation steps — numbered reproduction checklist.
- Exploit-DB matches — up to 5 ranked Exploit-DB candidates (CVE-exact, CPE+version, product keyword).
- AI narrative (Pro+) — plain-English description of the impact.
- AI remediation — actionable fix.
- OWASP category + CWE — maps to OWASP Top 10 and CWE Top 25.
Finding validation
Every finding goes through the Accuracy Gate before persisting:
- Raw detection by the tool (e.g., SQLi payload reflected).
- Second-pass verifier runs an orthogonal probe (e.g., time-based boolean that can't hit on reflection alone).
- Junk filter — anything that looks like a CSS filename, HTML fragment, or null response body is dropped.
- Only survivors are written to the DB.
If a finding made it to the list, it survived that gate. The Verified badge additionally means a third-party tool (sqlmap, nuclei, metasploit-style check) confirmed it independently.
Exploit-DB matches
Each finding gets ranked Exploit-DB candidates. Column meanings:
- confidence — 0.0–1.0, rolling up match type + CVE overlap + age-decay + platform alignment.
- match_type —
cve-exact/cpe-version/product-keyword. CVE-exact is the gold standard. - EDB — the Exploit-DB ID (click to open exploitdb.org).
Use Exploit-DB matches as search starters, not drop-in attack plans. Rank 1 is usually the best-fit historical exploit against your stack version.
Live feed (verbose logs)
Click Show verbose (or just leave the panel open while a scan runs) to stream every log line: which endpoints were probed, which payloads fired, what the response looked like. Huge volume, but invaluable when you're debugging "why didn't it find X?".
The feed is persistent: lines are buffered server-side in Redis (last 2,000 lines, 2-hour TTL). If you navigate away and return, or refresh the tab, the history reloads — you don't lose context just because you switched scans. Lines older than 2 hours roll off; persisted findings are unaffected.
External tool names are redacted from the log output (e.g. you'll see payload-tester rather than sqlmap) so the feed is safe to share over a screenshare.
"Fix Stuck" on a hung scan
If the live feed has frozen and the scan hasn't logged anything for an hour, a watchdog flips the scan to a stuck state and a Fix Stuck button appears on the row. Clicking it requeues the scan from its last checkpoint — the engine resumes from the next pending phase rather than starting from zero.
Export + share
- Export report — HTML, PDF, DOCX, JSON. See Report formats.
- Share link — tenant-scoped URL + optional time-bound token. Sharing a scan never exposes tenant-wide data; the recipient only sees this scan.
Manual testing tabs
Beyond Findings, the scan detail page exposes a full hands-on toolkit against the same captured requests:
- HTTP history — every request the scan made, with bodies.
- Site map — directory tree of discovered URLs.
- Forge — single-request crafter (edit, send, see response, repeat).
- Volley — payload-driven multi-request runner with four insertion modes (single position, mirror, lockstep, combo).
- Match & replace — rewrite outgoing requests on the wire.
- Sequencer — token entropy / randomness analysis.
- Decoder — encode / decode chain (URL, base64, hex, JWT, gzip, …).
- Comparer — diff two responses.
- OAST — out-of-band DNS / HTTP callback service for blind-vuln verification.
See Manual testing tools for the full guide.
What comes next
- Severity scale — how to triage by severity.
- Validation — deep-dive on how the Accuracy Gate works.
- Manual testing tools — Forge / Volley / OAST and friends.
- Report formats — pick the right export for the audience.